In 2002 a group of doctors counted how much a primary care physician would have to read to keep up. They took the 341 journals relevant to primary care and found 7,287 new articles a month.
Reading them with the care an epidemiologist would take, they estimated, would cost “627.5 hours per month, or about 29 hours per weekday”[1].
That was one specialty, sixteen years before I worked on this problem. In the 2018 fiscal year PubMed added 1,329,148 citations, about 3,600 a day (NLM).
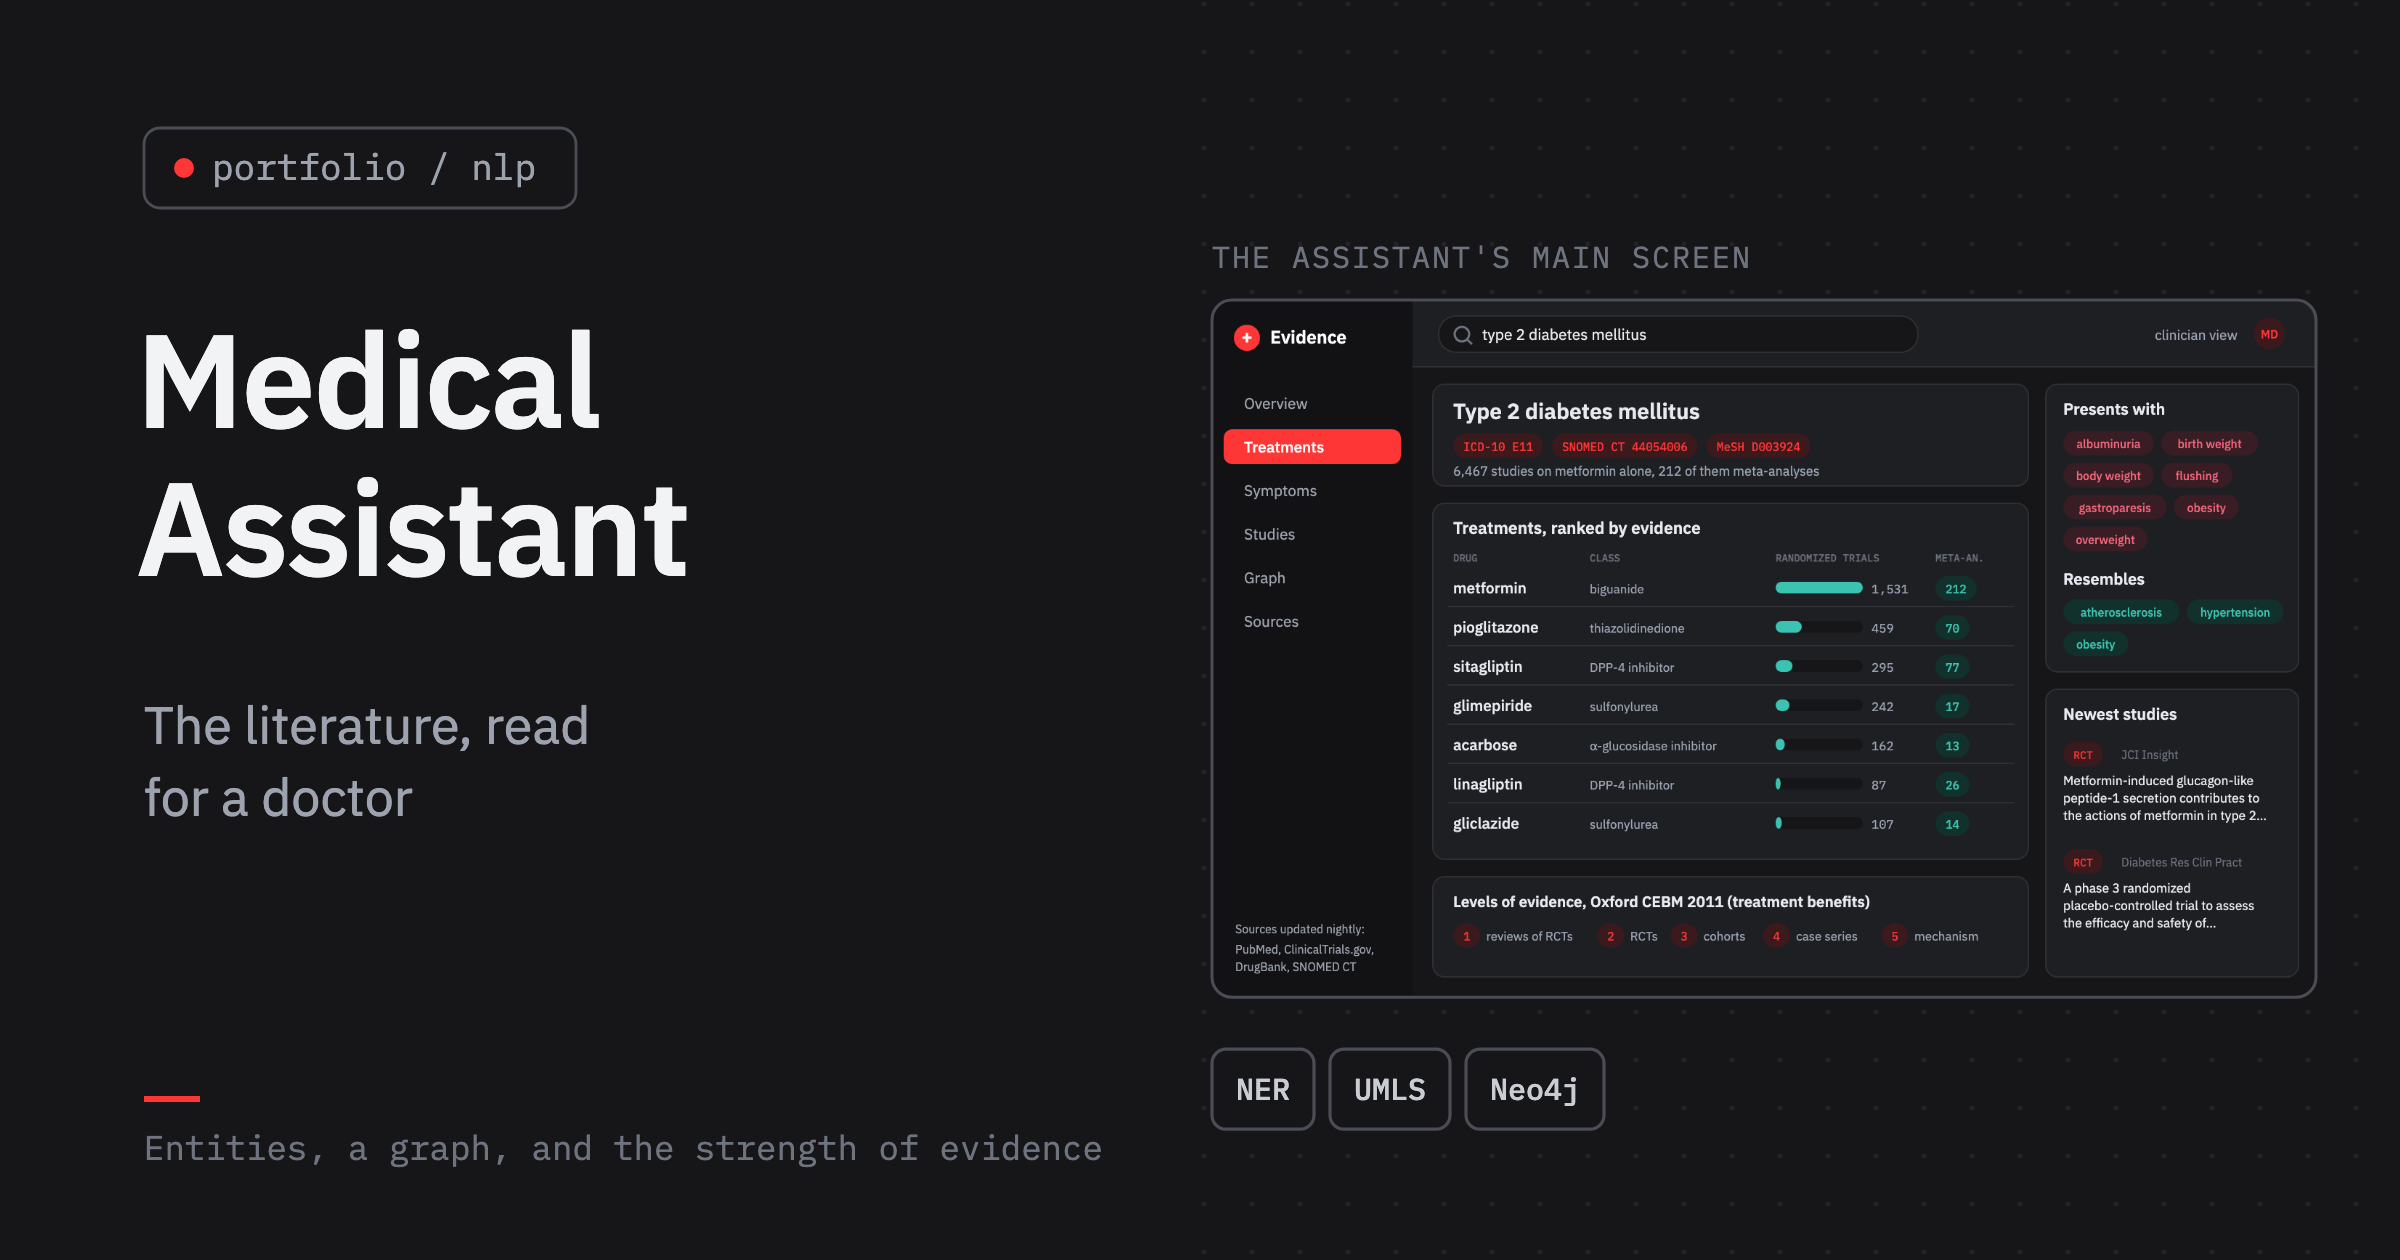
In 2017 and 2018 I worked as a data scientist at Meanotek, a small company building language technology, on an assistant that would do this reading for a doctor. Ask it about a disease, and it shows the treatments, the symptoms, the related conditions and the studies behind each claim, with an honest note on how strong those studies are.
The project’s screenshots have not survived, so the screen below is drawn again for this page. The numbers on it are real: PubMed counts up to 2018 and the links of a public 2017 knowledge graph.
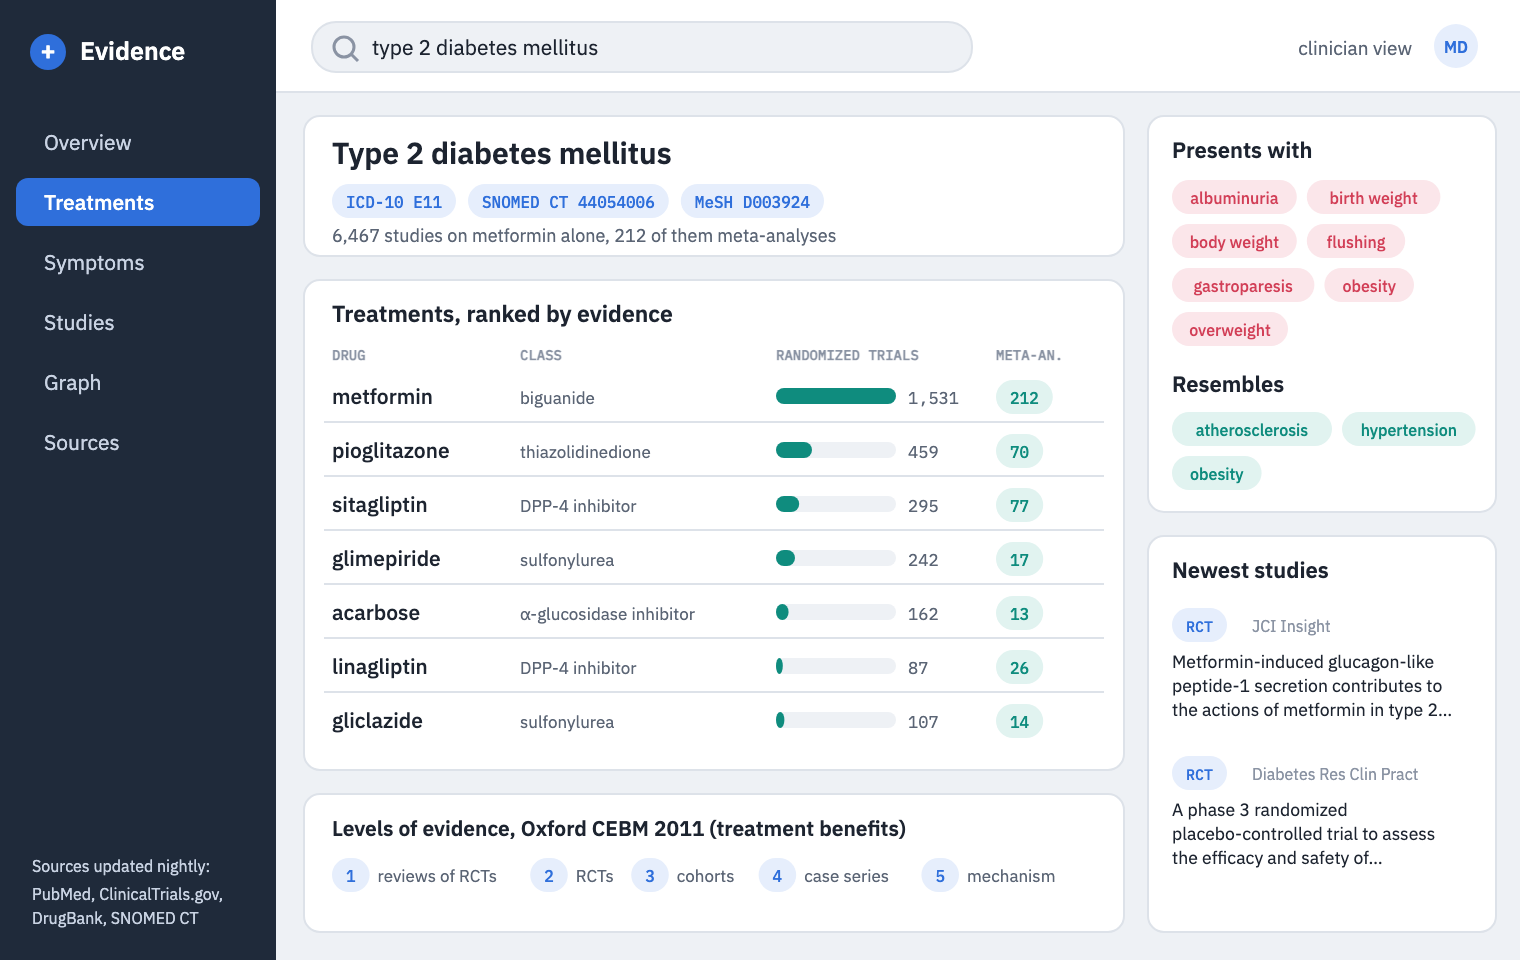
The assistant's main screen, reconstructed. Counts: PubMed, publication years up to 2018. Symptoms and similar diseases: Hetionet v1.0.
How fast the literature grows
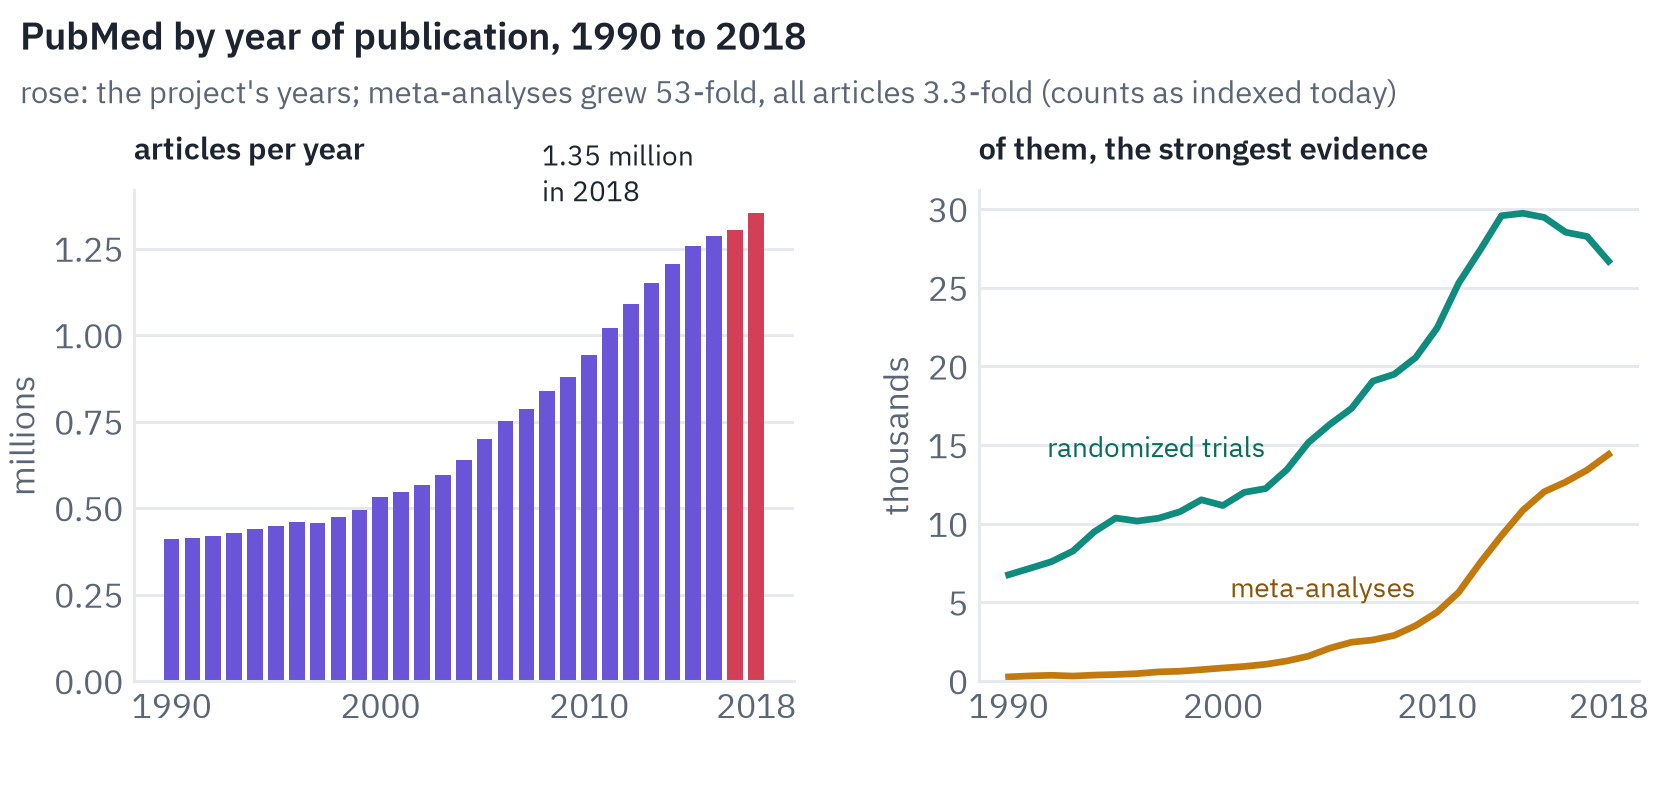
The growth is not only in volume. The kinds of studies a doctor trusts most grew faster than everything else: meta-analyses, which pool the results of many trials, went from a few hundred a year in 1990 to over fourteen thousand in 2018.
That is good news and a problem at once. The best evidence on a question now exists more often, but it sits among a million other articles a year, and a search box returns them all in the same list.
Finding the entities
The first step is to find what an article talks about: diseases, symptoms, drugs, doses, outcomes. This is named entity recognition, and for medical text it starts with a decision about what counts.
Is “lower risk of hypoglycemia” a mention of a disease? Is “insulin glargine” one drug or a drug and a modifier? Is “type 2” part of the name?
I wrote the annotation guidelines that answered questions like these, because a model can only be as consistent as the people who label its training data.
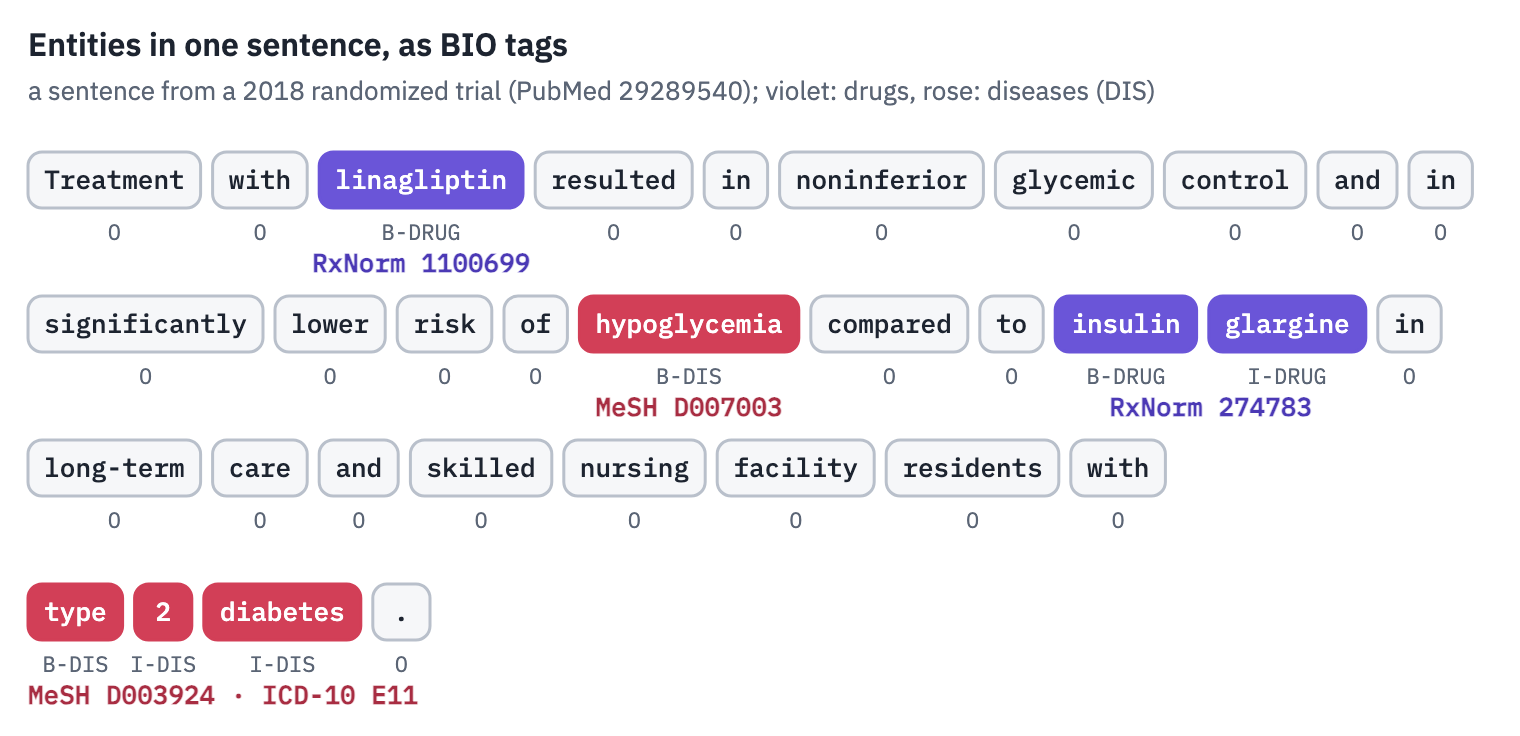
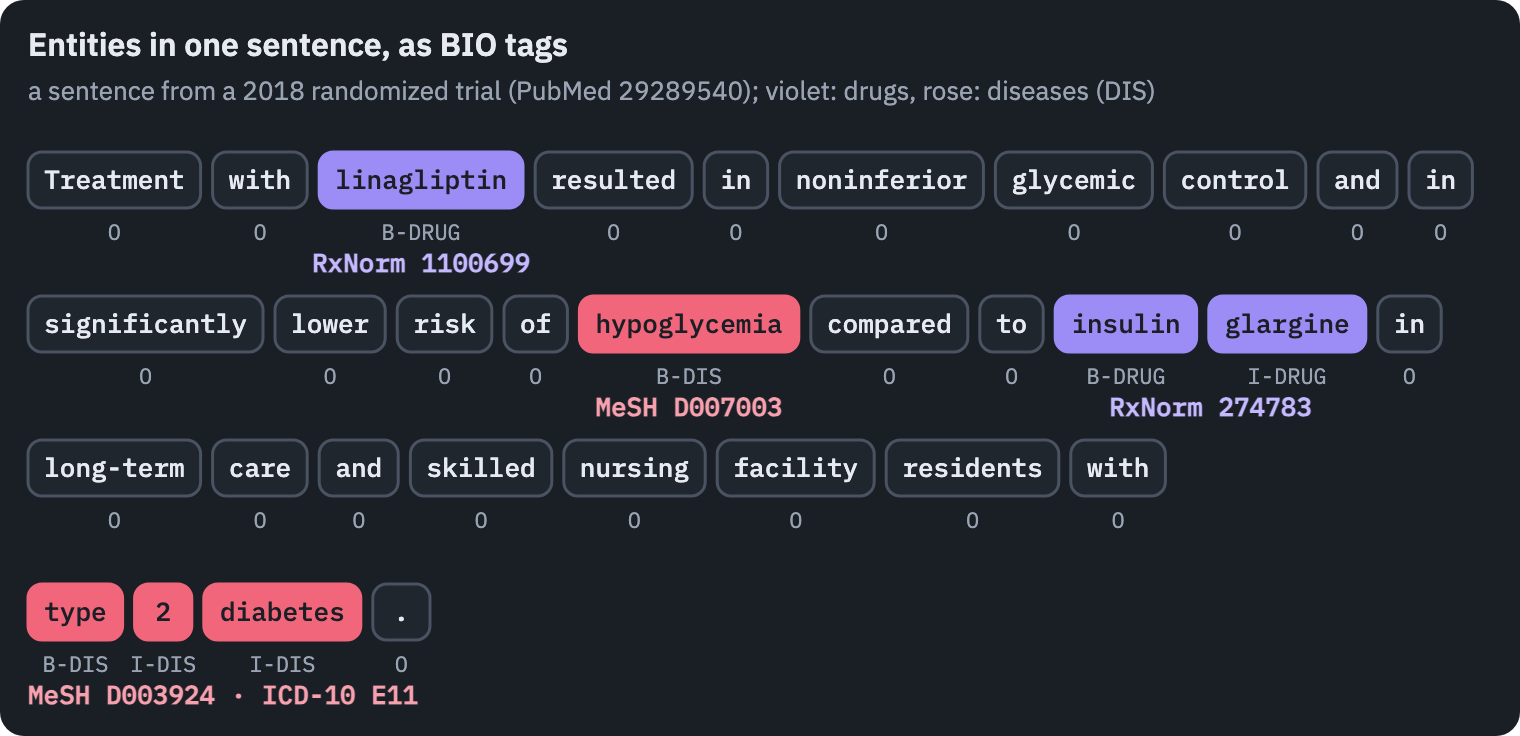
The usual format is BIO: every token is tagged as the beginning of an entity, inside one, or outside. The tagger of choice in 2017 was a bidirectional LSTM with a conditional random field on top, the CRF making sure an “inside” tag never follows an “outside” one[2, 3].
Habibi and colleagues showed in 2017 that one generic LSTM-CRF, fed with word vectors trained on PubMed, beat entity-specific tools on 33 biomedical datasets: “On average, F1-score of LSTM-CRF is 5% above that of the baselines, mostly due to a sharp increase in recall”[4].
The vectors themselves were trained on 5.5 billion tokens of PubMed and PubMed Central[5].
The public training data was small. The NCBI disease corpus has 793 PubMed abstracts with 6,892 disease mentions[6]; BC5CDR adds 1,500 articles with chemicals and diseases[7]. For a product, the rest of the labels had to come from our own annotation.
The field moved fast around us. ELMo, with word representations that depend on the sentence, appeared in February 2018[8], and BERT in October 2018[9]. BioBERT, trained on PubMed, came out in January 2019, after this project[10].
Many names for one thing
Finding “heart attack” in a sentence is half the job. The other half is knowing that it is the same thing as “myocardial infarction”, “MI” and “acute MI”, and that “Glucophage” is metformin.
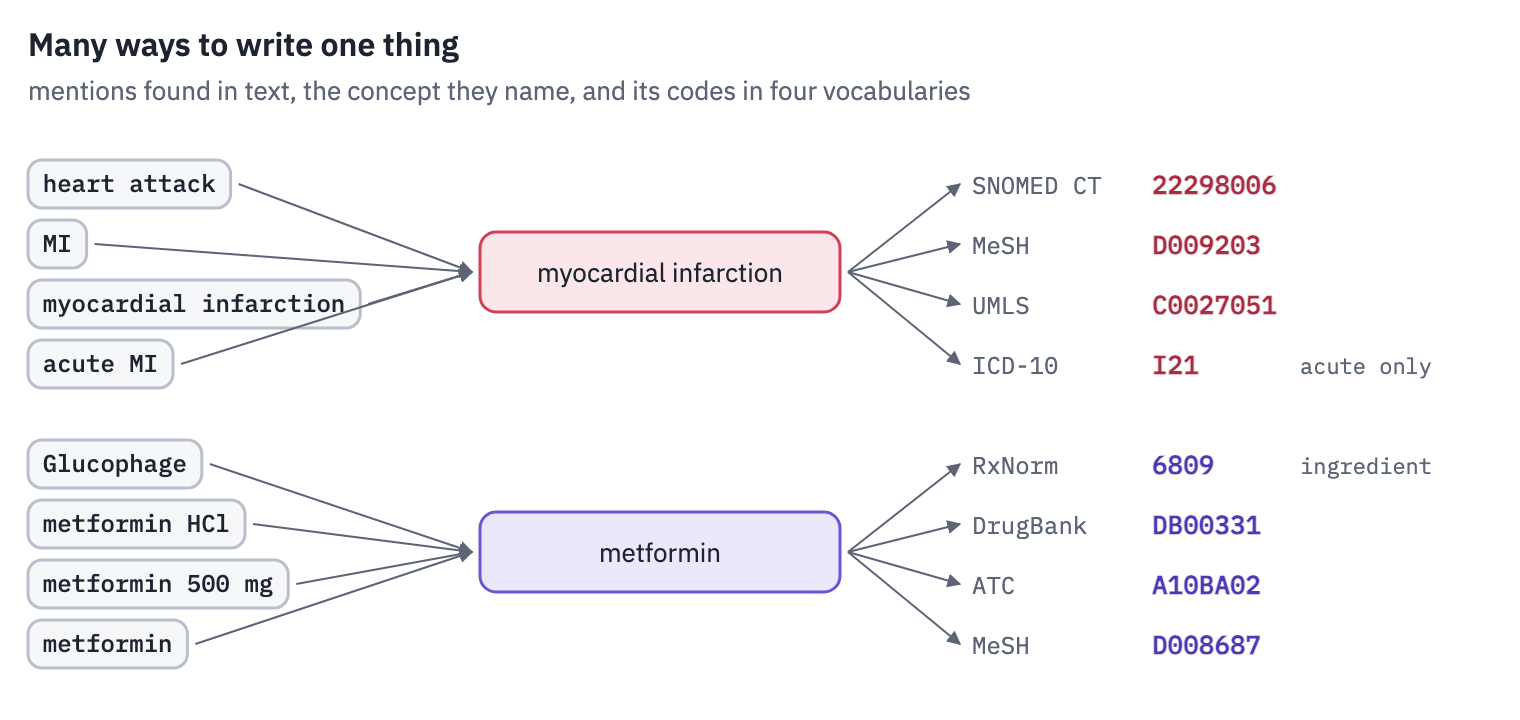
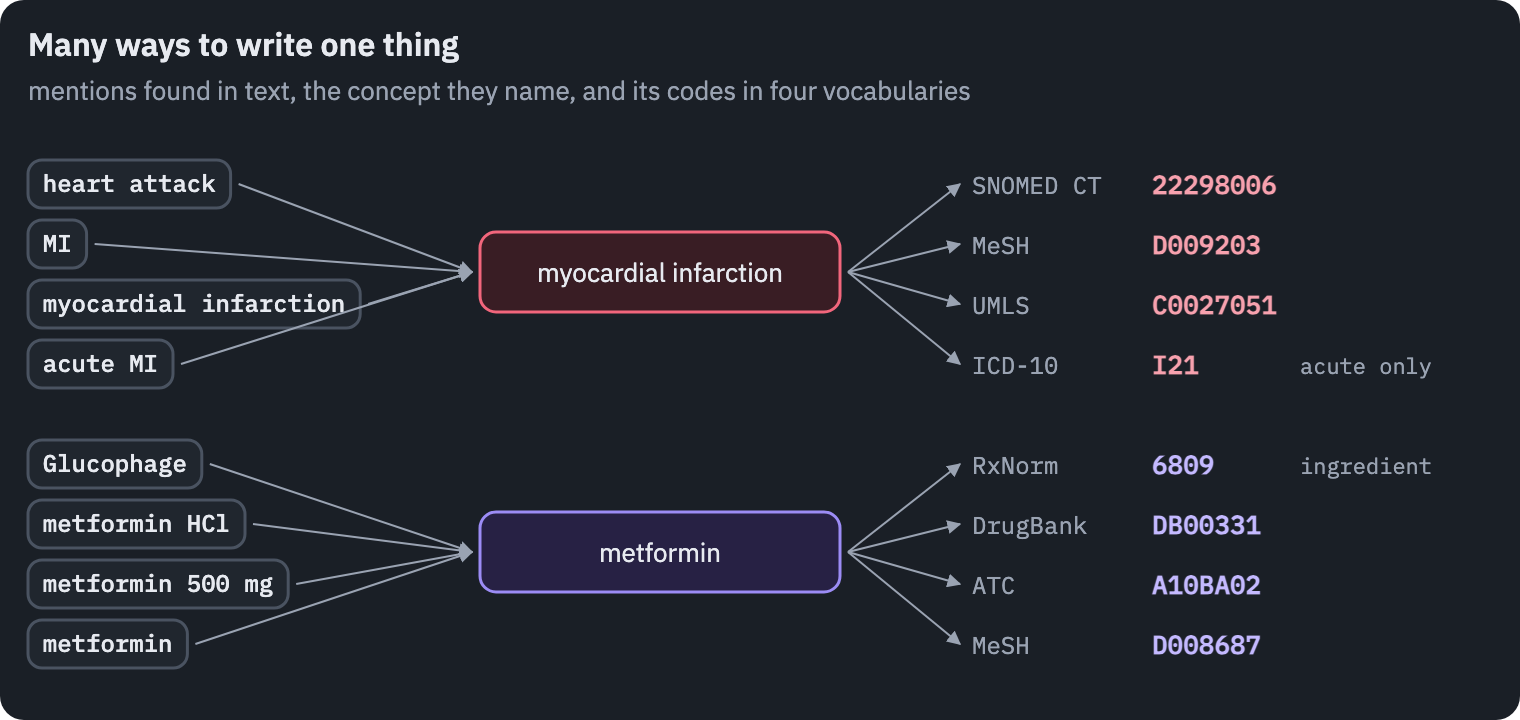
Medicine has vocabularies for this, more than one. The Unified Medical Language System links them: its 2018 release held “approximately 3.67 million concepts and 14 million unique concept names from 203 source vocabularies”[11]. SNOMED CT alone had 340,659 active clinical concepts in July 2018 (SNOMED International).
Drugs have their own system, RxNorm, “a normalized naming system for generic and branded drugs” (NLM). It is why a dose, a salt and a brand name can all be traced to one ingredient.
The vocabularies do not map one to one, and the differences matter. SNOMED CT has one concept for myocardial infarction; ICD-10, the classification hospitals used then, splits it into acute (I21), subsequent (I22) and old (I25.2). WHO released ICD-11 in June 2018, but as “an advance preview”, to come into effect in 2022[12].
Dictionary tools did the matching before neural taggers did: MetaMap from the National Library of Medicine[13], and QuickUMLS, “up to 135 times faster”[14]. They are precise on exact names and lost on everything else, which is where a trained tagger helps and the two are best combined.
A graph instead of tables
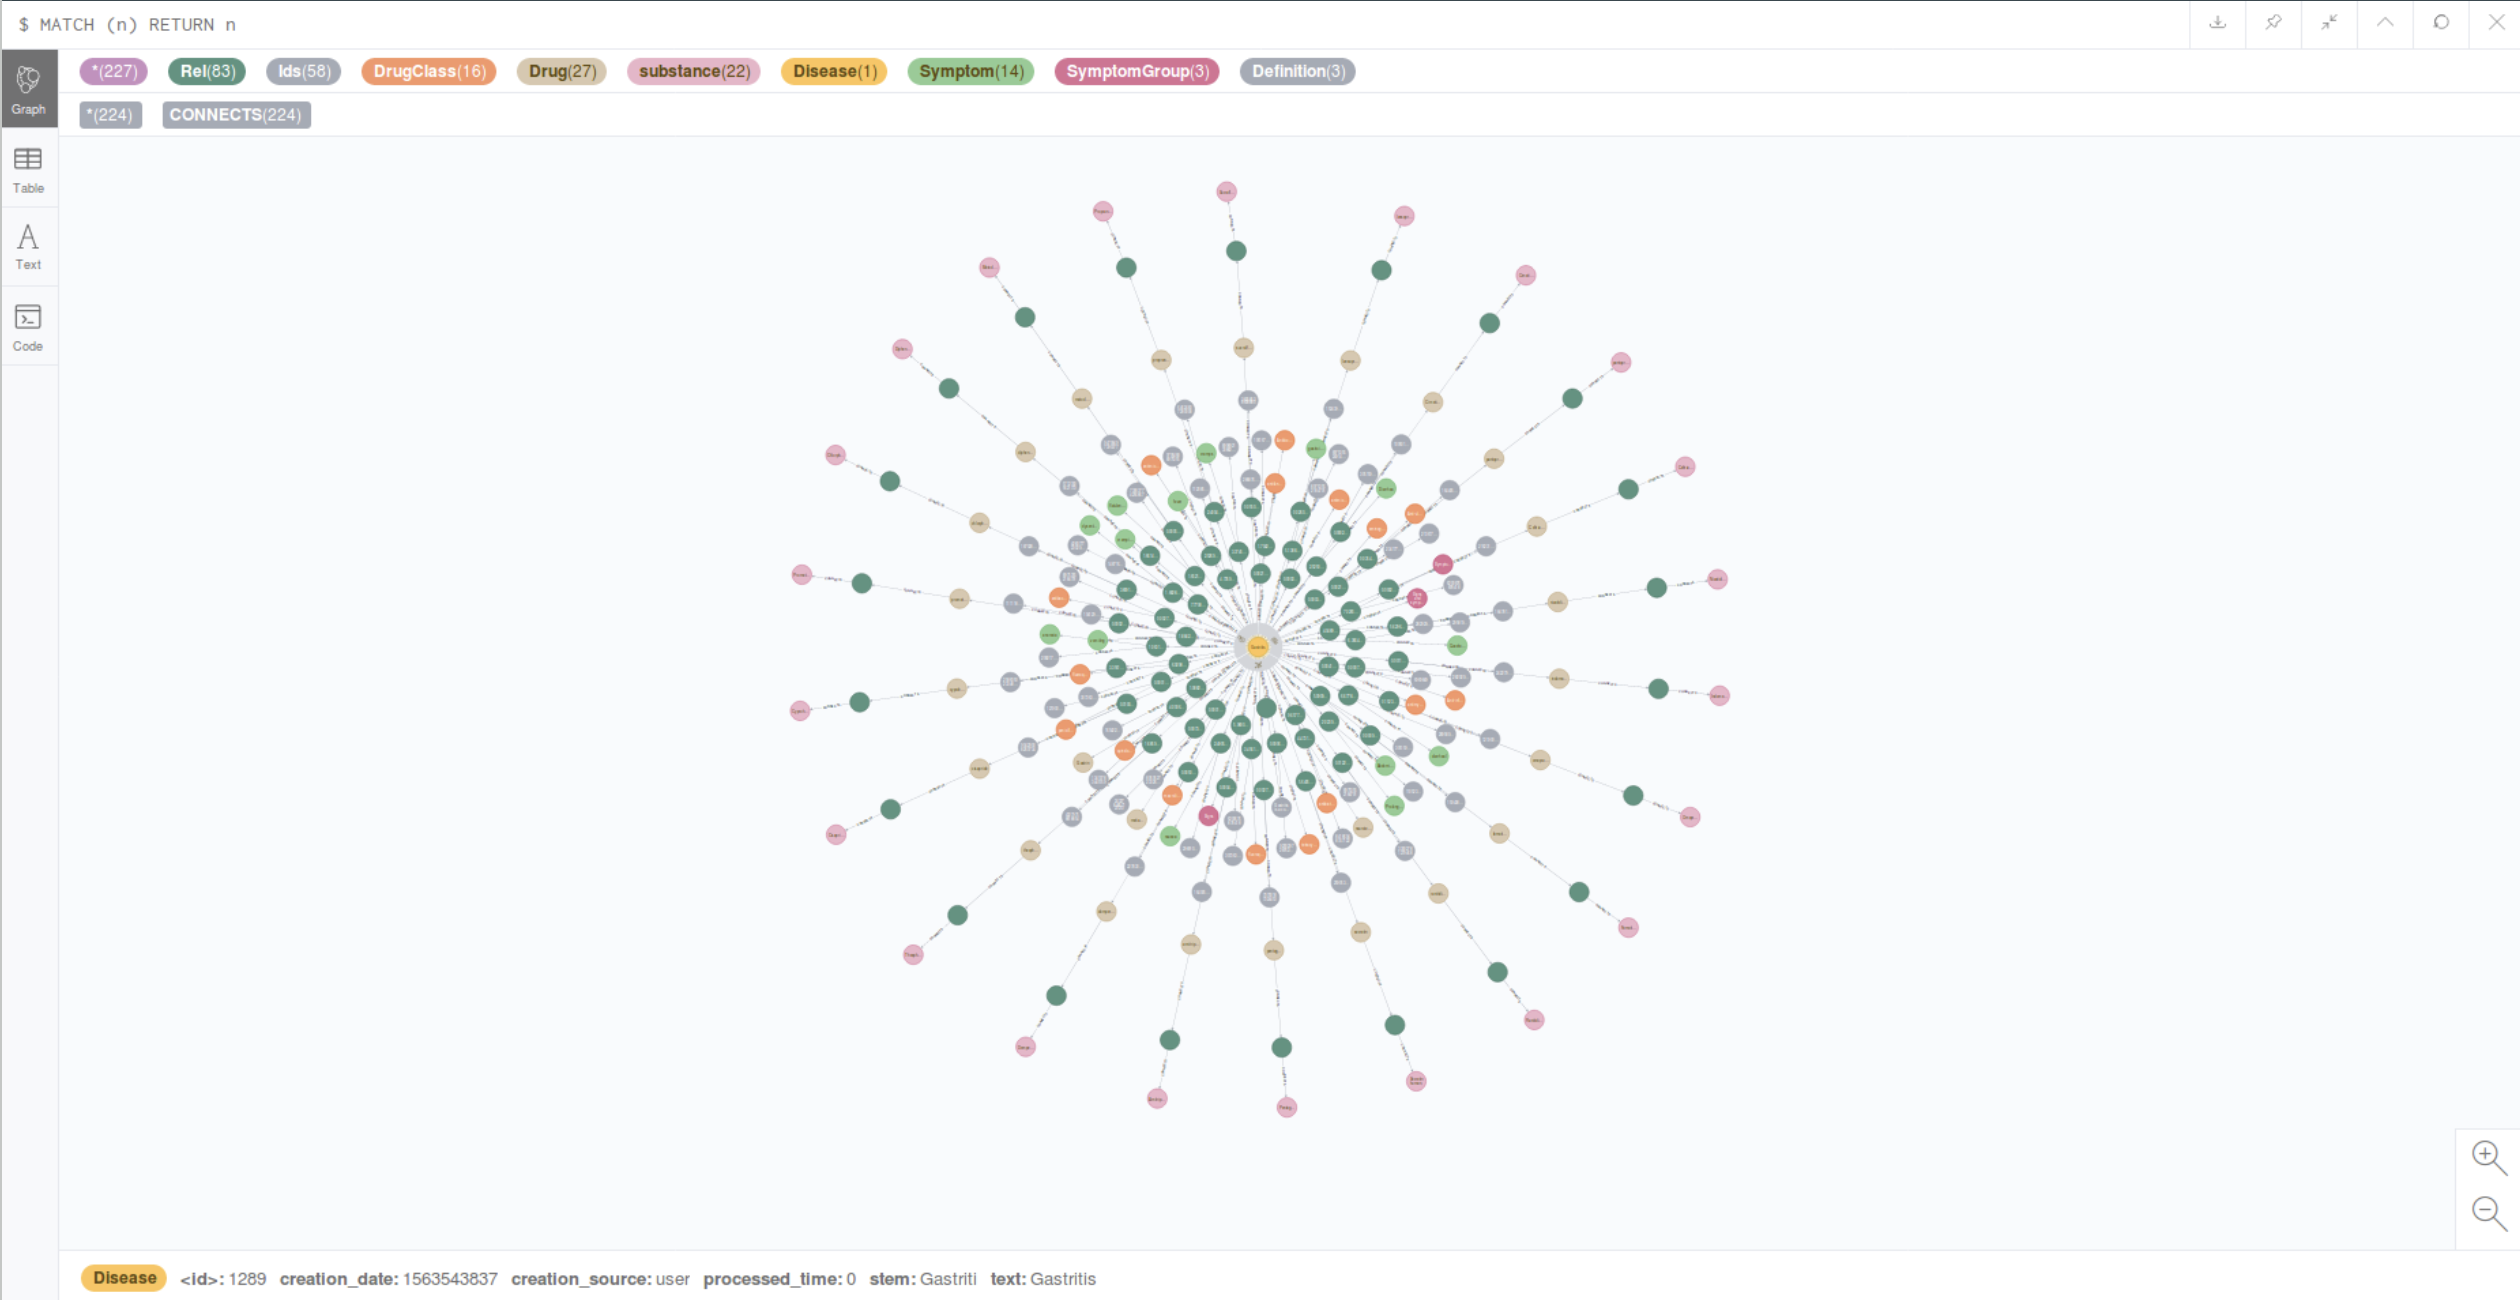
One disease in the project's graph, in the Neo4j browser: gastritis at the centre of 227 nodes, coloured by type.
Once entities are found and named, the question is where to keep them. Medical knowledge is mostly relations: a drug treats a disease, belongs to a class, interacts with another drug; a disease presents a symptom, resembles another disease. In a relational database each of these is a join table; in a graph database it is just an edge.
We kept the entities in Neo4j, “an open-source NoSQL native graph database” that had been public since 2007[15]. A question like “which drugs of this class treat diseases that resemble this one” becomes a short pattern in its query language, Cypher.
The idea was not ours alone. In 2017 Himmelstein and colleagues published Hetionet, a graph of “47,031 nodes of 11 types and 2,250,197 relationships of 24 types” integrated from 29 public resources, and served it as a Neo4j database anyone could query[16].
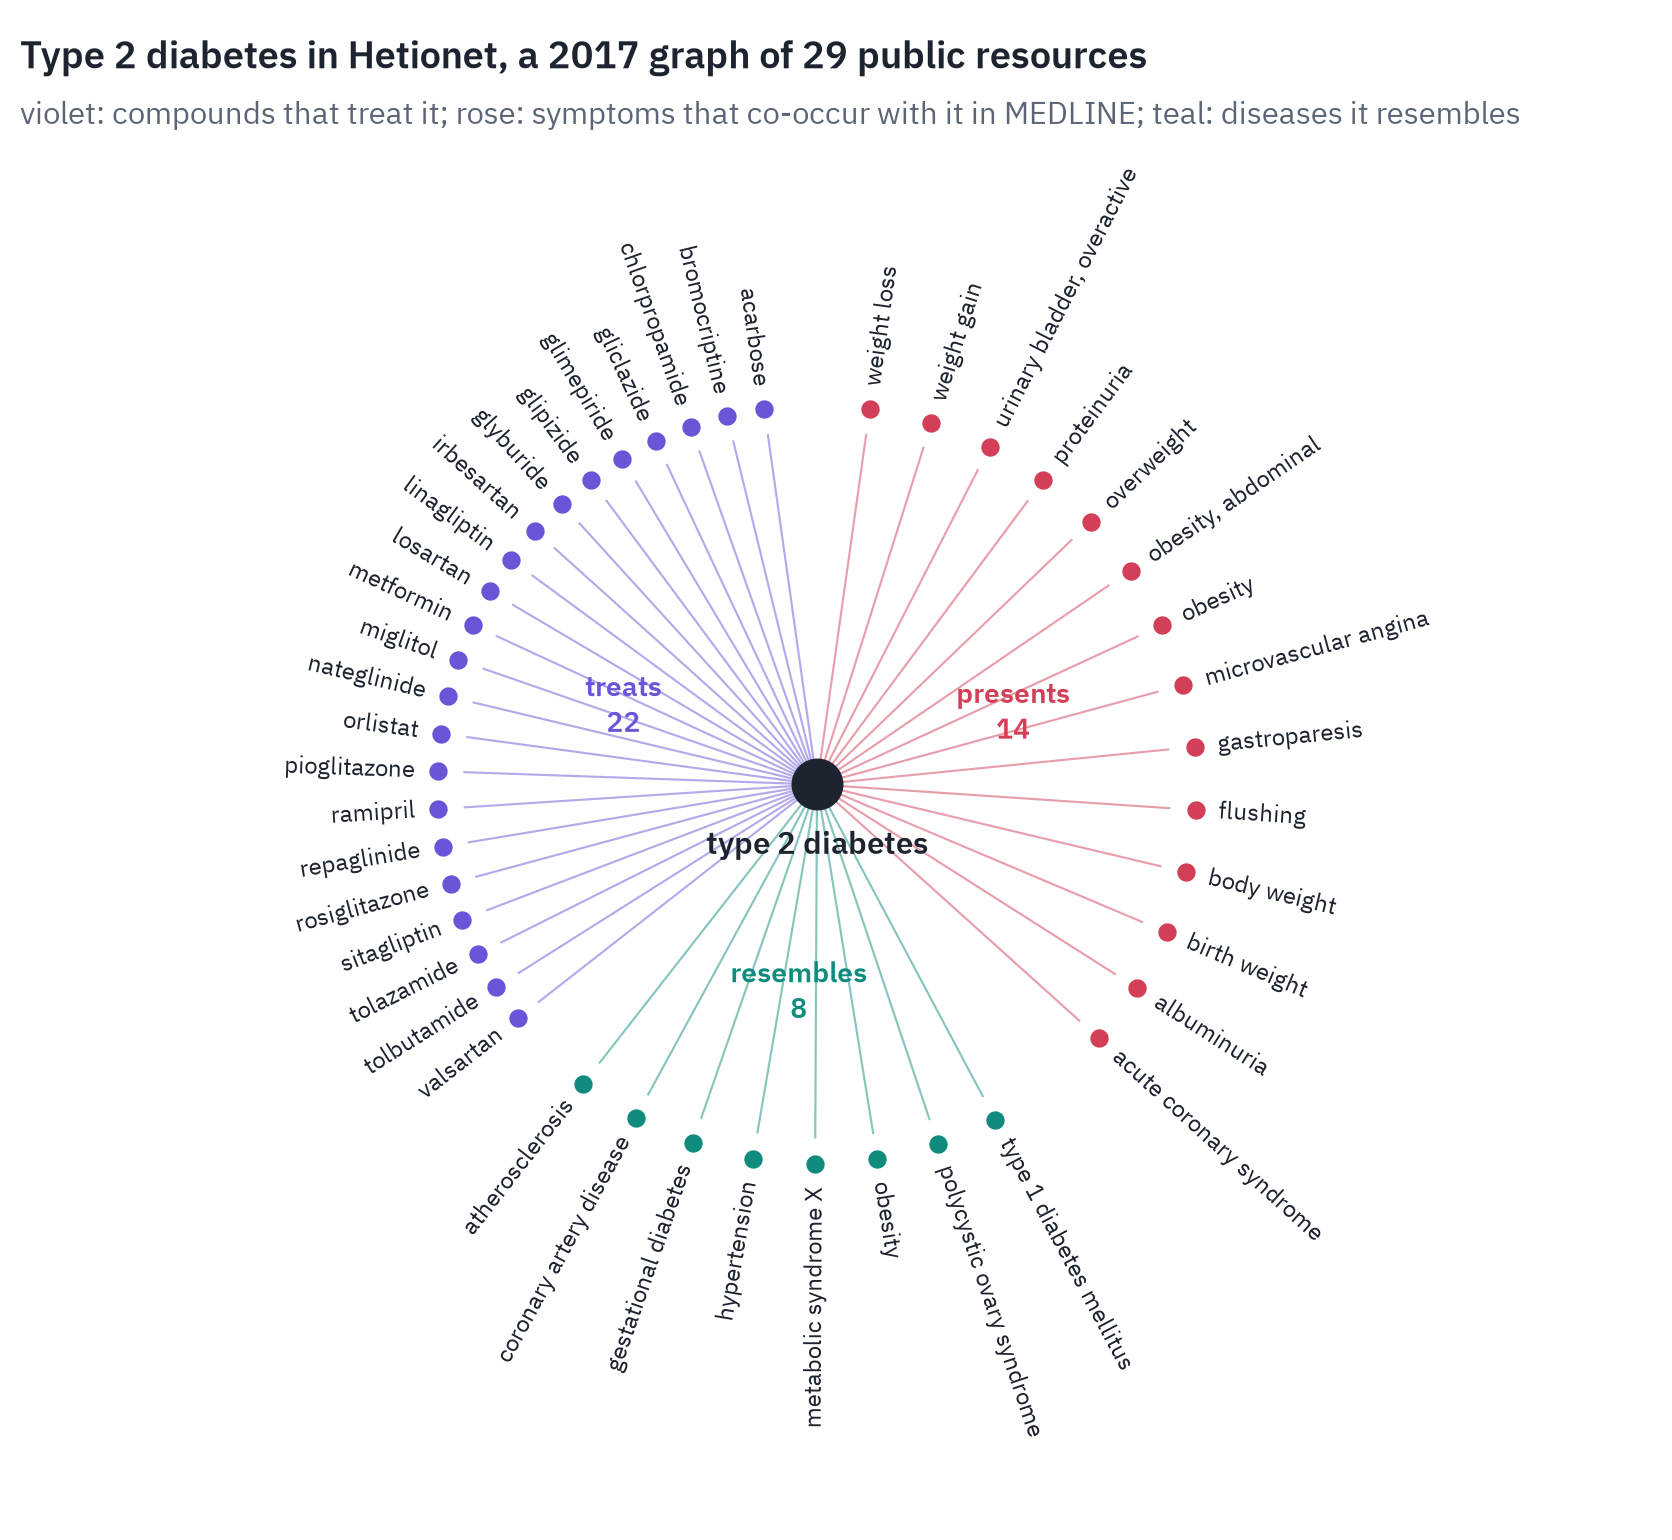
The figure is type 2 diabetes in Hetionet, and it shows a trap of building such a graph from text.
The symptoms come from co-occurrence in MEDLINE, so next to obesity and albuminuria sit birth weight and flushing: words that often appear in the same articles, not signs a doctor would look for. A graph built by counting needs a filter, and a doctor needs to see where each edge came from.
How much to trust a study
An assistant that lists every study with equal weight is a search engine. The useful part is telling a meta-analysis of randomized trials from a case report.
Evidence-based medicine has a ladder for this. In the Oxford levels of 2011, a systematic review of randomized trials is level 1 for questions of treatment, a single randomized trial is level 2, and “mechanism-based reasoning” is level 5[17].
GRADE rates the quality of a body of evidence as high, moderate, low or very low, and starts observational studies at low[18].
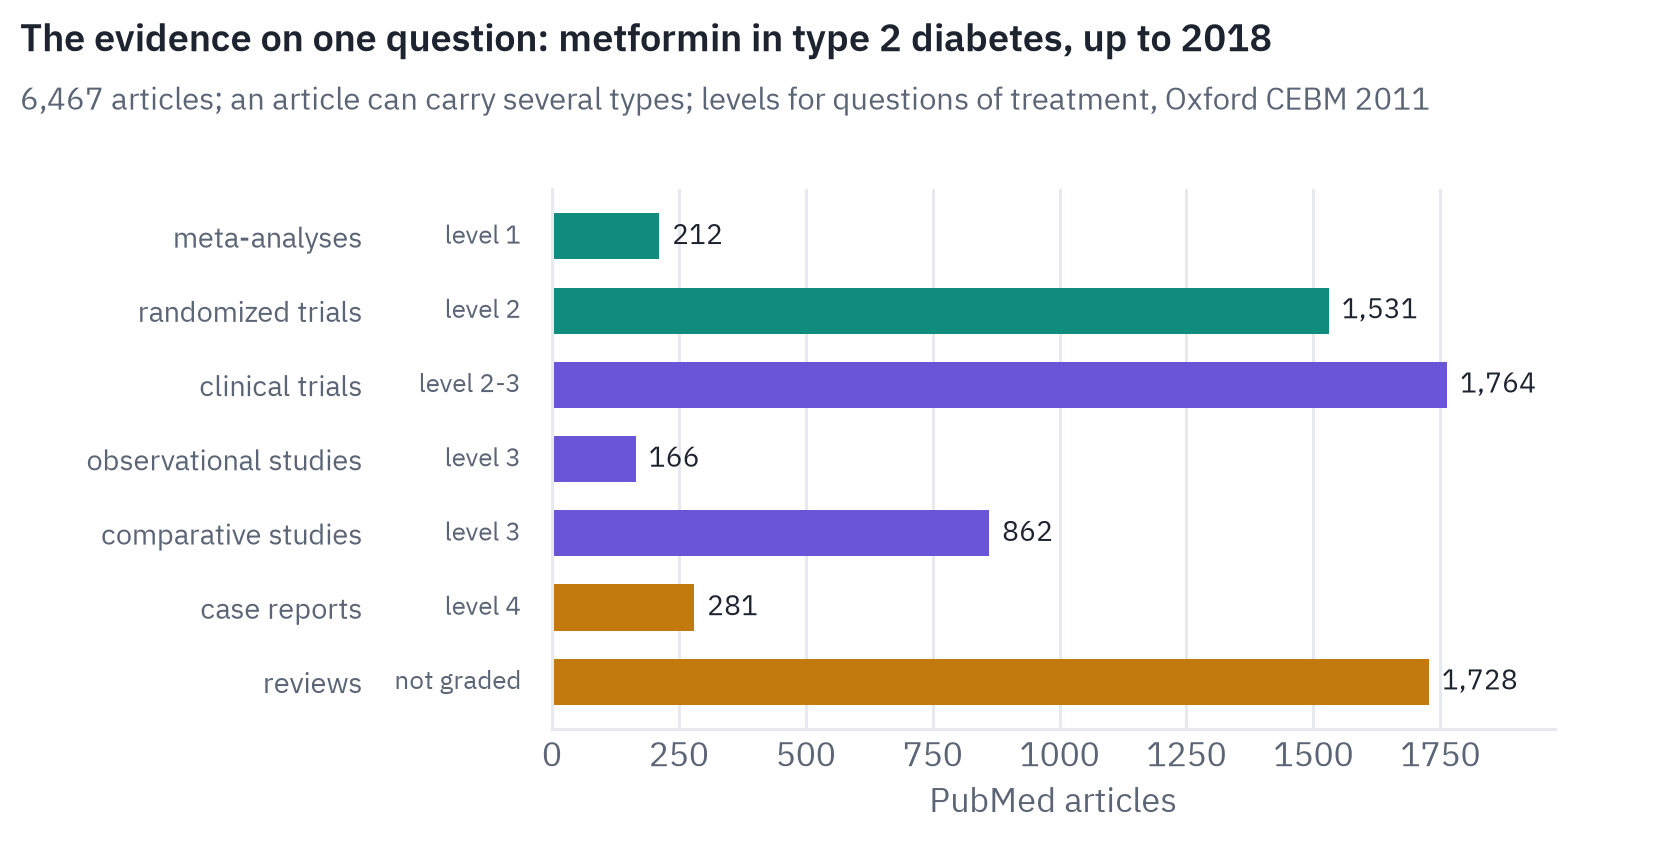
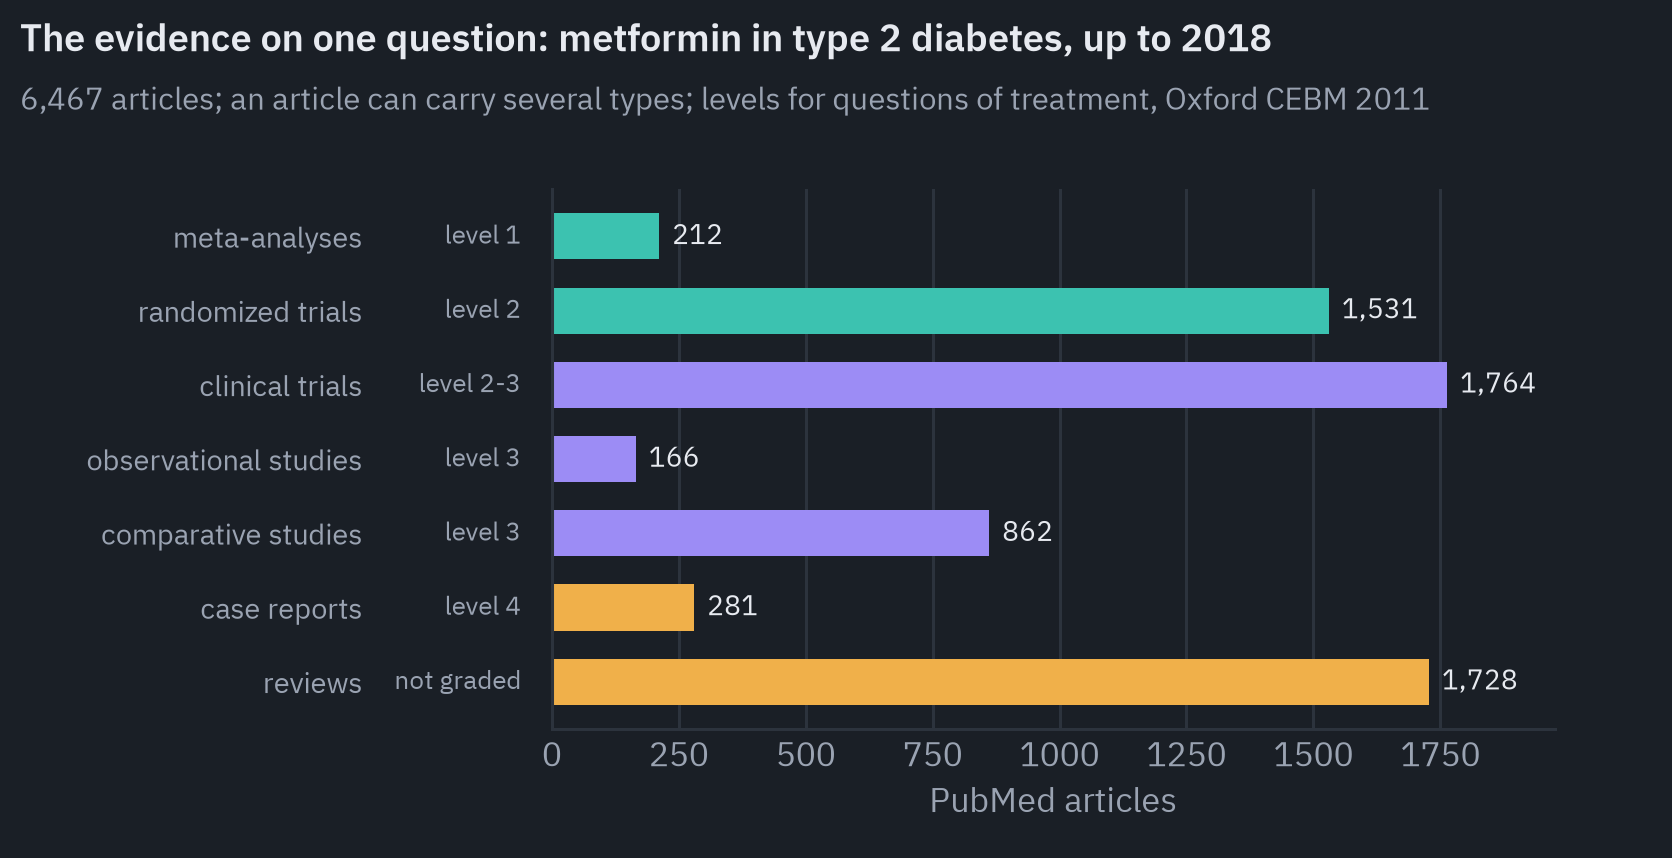
PubMed labels articles with publication types, and those labels are the first signal. They come late: Marshall and colleagues measured “a lag time of around 250 days from publication until the PT tag is applied”, and trained a classifier to recognize randomized trials from their text instead[19].
The newest studies, the ones a doctor most wants to hear about, are exactly the ones without labels. We classified publications with classical machine learning on what could be measured about them: the design of the study, the quality of its data, how often it was cited, the record of its authors.
RobotReviewer had shown that even the risk of bias in a trial could be judged by a model with useful accuracy[20].
The cautionary example of the time was IBM’s Watson for Oncology. In September 2017 STAT reported that its recommendations were “derived from the training provided by the hospital’s doctors, not the outside literature”[21]. In July 2018 it reported internal documents citing “multiple examples of unsafe and incorrect treatment recommendations”[22].
It is the reason the assistant was built to show evidence and its strength rather than to recommend, and to leave the decision to the doctor.
The system
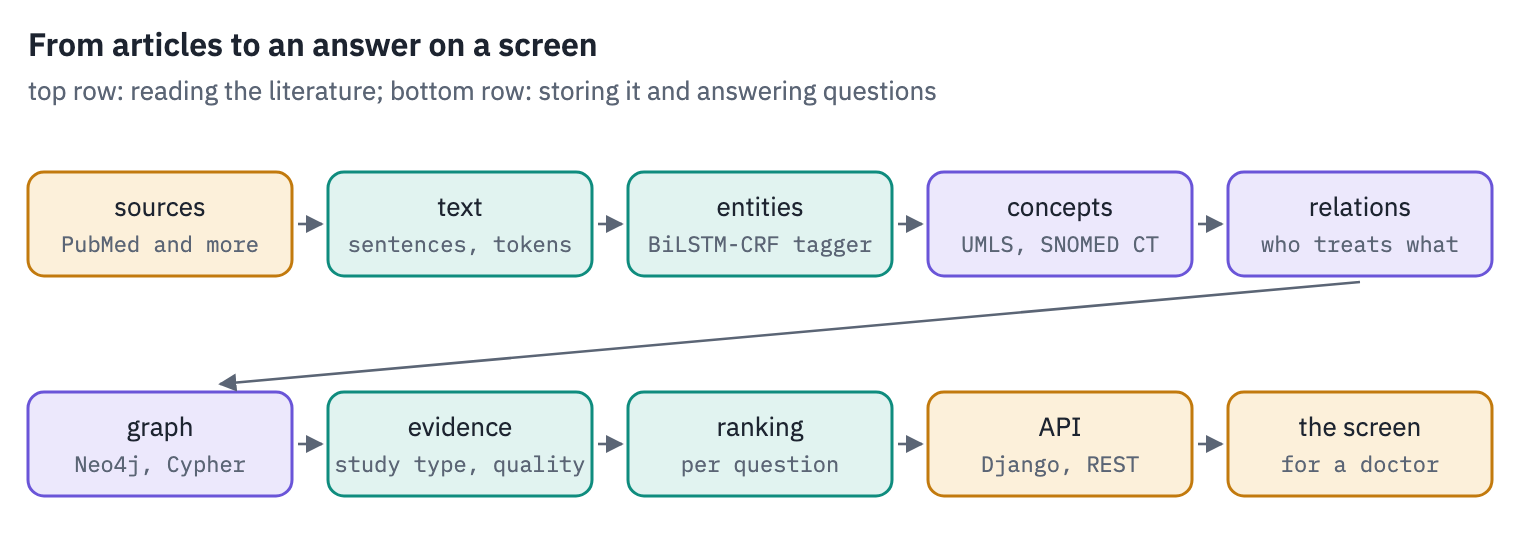
Behind the screen, sources were downloaded and parsed, entities and relations were extracted, and the results went into two stores: PostgreSQL for the articles and their metadata, and Neo4j for the entities and their links. A Django service answered the screen’s questions over a REST API.
References
- Alper et al. How much effort is needed to keep up with the literature relevant for primary care? J Med Libr Assoc, 2004. ↩
- Huang, Xu and Yu. Bidirectional LSTM-CRF Models for Sequence Tagging. 2015. ↩
- Lample et al. Neural Architectures for Named Entity Recognition. NAACL 2016. ↩
- Habibi et al. Deep learning with word embeddings improves biomedical named entity recognition. Bioinformatics, 2017. ↩
- Pyysalo et al., 2013. bio.nlplab.org. ↩
- Doğan, Leaman and Lu. NCBI disease corpus. J Biomed Inform, 2014. ↩
- Li et al. BioCreative V CDR task corpus. Database, 2016. ↩
- Peters et al., 2018. arxiv.org. ↩
- Devlin et al., 2018. arxiv.org. ↩
- Lee et al., 2019. arxiv.org. ↩
- NLM, 2018. nlm.nih.gov. ↩
- WHO, 2018. who.int. ↩
- Aronson. Effective mapping of biomedical text to the UMLS Metathesaurus: the MetaMap program. AMIA, 2001. ↩
- Soldaini and Goharian. QuickUMLS. MedIR workshop, SIGIR 2016. ↩
- Neo4j, 2018. web.archive.org. ↩
- Himmelstein et al. Systematic integration of biomedical knowledge prioritizes drugs for repurposing. eLife, 2017. Data. ↩
- OCEBM Levels of Evidence Working Group. The Oxford 2011 Levels of Evidence. ↩
- Guyatt et al. GRADE: an emerging consensus on rating quality of evidence and strength of recommendations. BMJ, 2008. ↩
- Marshall et al. Machine learning for identifying randomized controlled trials. Research Synthesis Methods, 2018. ↩
- Marshall et al. RobotReviewer: evaluation of a system for automatically assessing bias in clinical trials. JAMIA, 2016. ↩
- Ross and Swetlitz, 2017. statnews.com. ↩
- Ross and Swetlitz, 2018. statnews.com. ↩